Vaccine Data Available for US States
December 24, 2020 > 91-DIVOC-01: "An interactive visualization of the exponential spread of COVID-19"

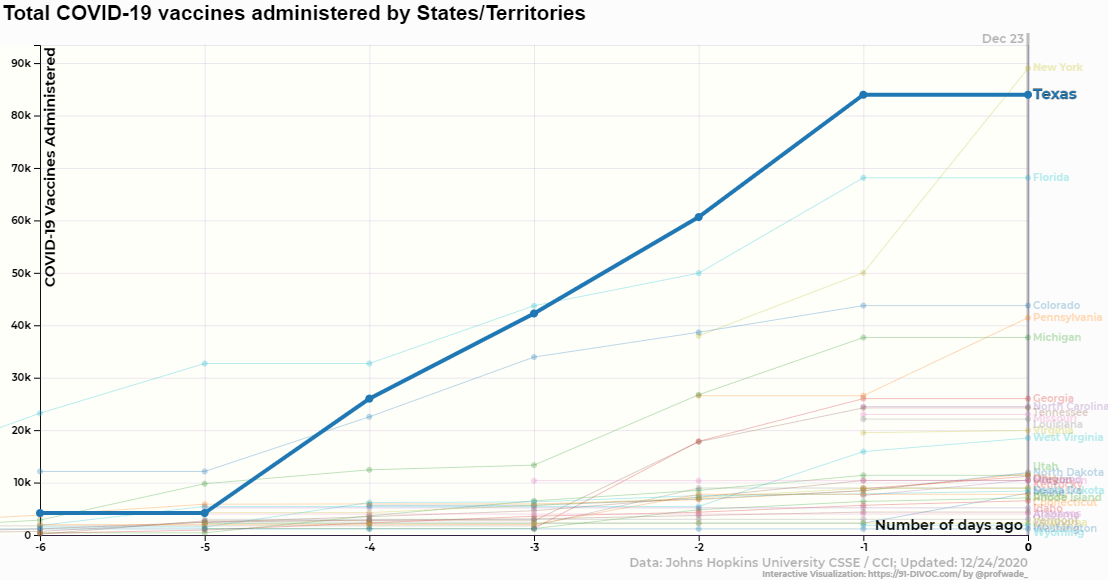
As the vaccination against COVID-19 begins, many US states are beginning to report total numbers of vaccinations. This data is now provided on the US state-level graphs, including the normalized views. This data is sourced/compiled by the Centers for Civic Impact at Johns Hopkins University, as JHU continues to lead the way in providing fantastic, open-source COVID-19 data.
The four new 91-DIVOC visualizations include:
- Total COVID-19 vaccines allocated to each state
- Total COVID-19 vaccines administered by each state
- New COVID-19 vaccines administered /day
- New COVID-19 vaccines administered /day (7-day average)
Happy Holidays! :)