More Derivative Charts
October 30, 2020 > 91-DIVOC-01: "An interactive visualization of the exponential spread of COVID-19"
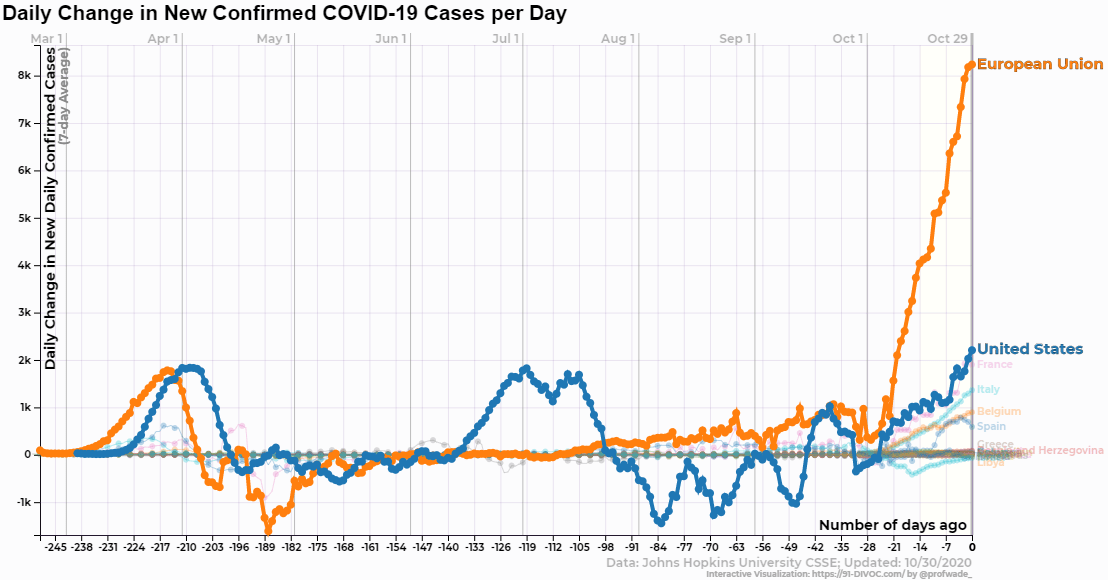
I received a number of questions (and a lot of interest) on the derivative charts that were recently added – the charts helped show the overall trends, but the day-of-week swings in the underlying data made the chart less useful beyond that. To help provide more context around the derivative charts, I’ve added derivative charts of the “One-Week Rolling Averages” to answer the question: What is the daily change in the 1-week rolling average? Additionally, this new derivative can also be viewed, itself, as a one-week average.
- Add four more derivative charts, all of the one-week rolling average values
- Fixed a typo in the mouseover tooltip on the derivative charts.