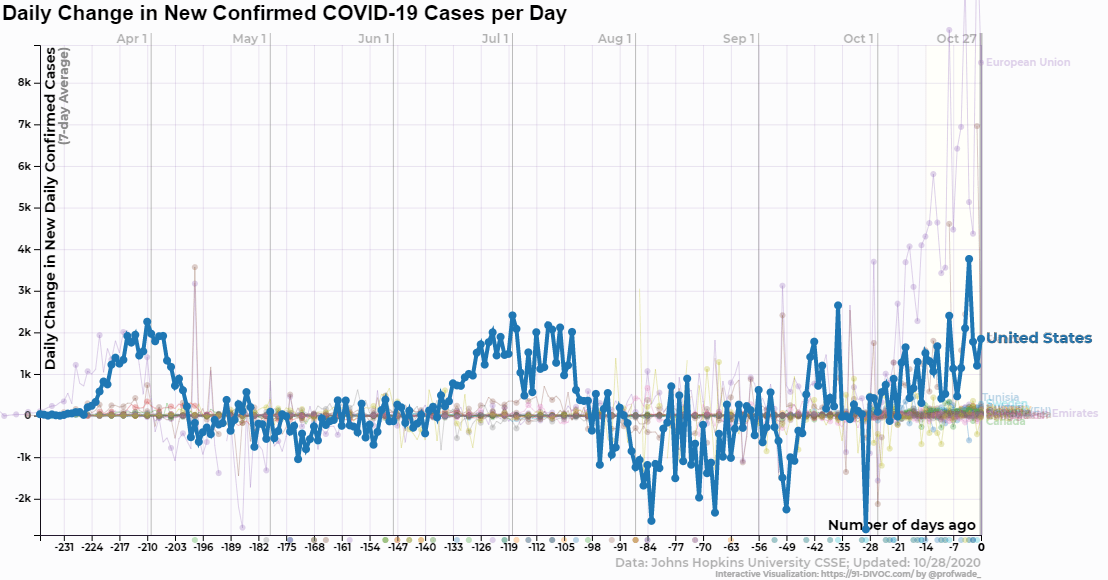
Derivative and Experimental Charts
October 28, 2020 > 91-DIVOC-01: "An interactive visualization of the exponential spread of COVID-19"

Added several new data selections:
-
“Derivative Charts” that show the change of the daily cases. A positive derivative indicates that the there is currently the daily cases are increasing at an increasing rate, a zero derivative indicates that there is no change in daily cases (the same number of new cases were detected yesterday and today), and a negative derivative indicates that there is a deceasing number of new daily cases (fewer new cases were detected today than yesterday).
-
“Experimental Charts” that are playing around with non-transitional charts (mostly out of request from others). The current two show a the current case fatality rate using a 2-week or 4-week lagged number of cases.