Big Ten Conference COVID-19 Chart Updates
November 30, 2020 >

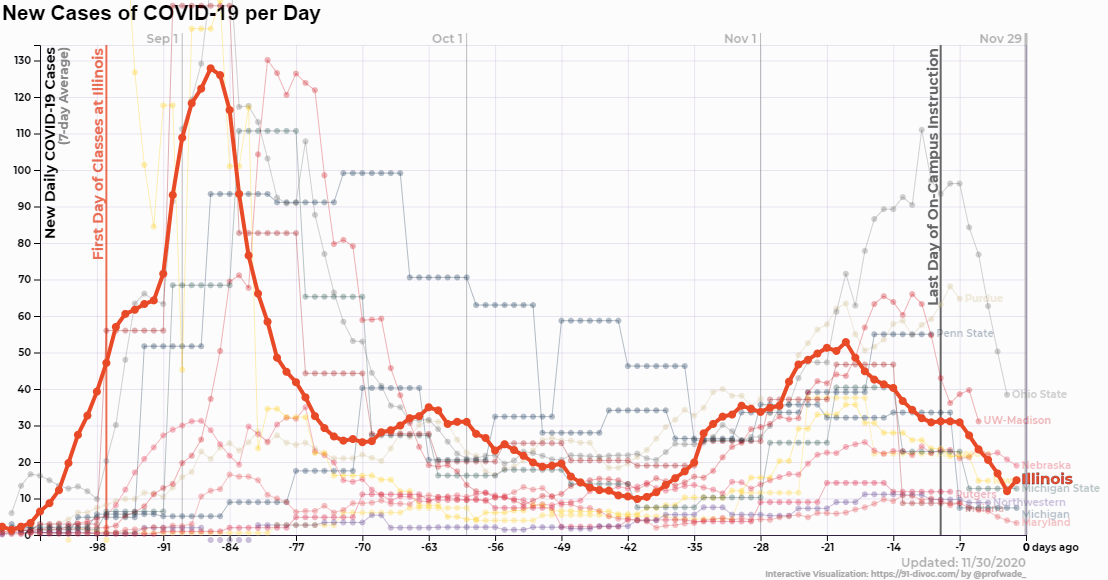
With the end of in-person courses, I’ve updated the Big Ten visualization of COVID-19 data to provide context of the full semester for all of the Big Ten schools:
- By default, the view now beings at the beginning of the Fall semester, instead of 8 weeks ago. The old view of 8-weeks is still available under the “X-Axis” display option.
- When you highlight a school (and the beginning of the Fall semester is in range), an indicator of the beginning of the semester is added to the graph.
- An additional indicator has been added for the last day of in-person instruction. (Some Big Ten schools are completely finished with the semester, like Nebraska, while others are fully online for the rest of the term like Illinois.)