Lowest/Highest Value Since in Mouseovers
August 18, 2021 > 91-DIVOC-01: "An interactive visualization of the exponential spread of COVID-19"
When you mouseover (or tap) a data point and the datapoint is the a low or high value that hasn’t been seen in at least 10 days, the mouseover now displays the last time that value was above/below that value. For example:
-
In the United States, on Aug. 17, we had the highest value of new confirmed cases since Feb. 3, 2021 – or 194 days ago.
-
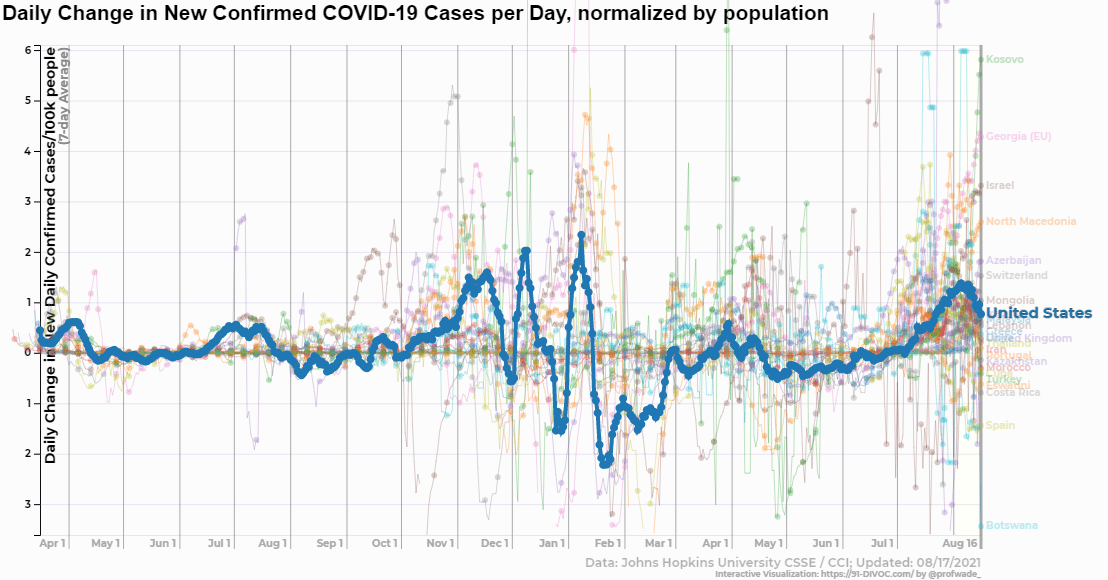
The image linked goes to a graph of the daily change in new confirmed COVID-19 cases per day, one of the few graphs where the United States is showing signs of improving in mid-August where cases are increasing at a decreasing rate, you can find that on Aug. 17 is the lowest value since 25 days ago – on July 22nd.
In addition, the “X-Axis” has been updated with additional axis options to display gridlines as weeks or months. :)