Expanding Graphs on Large Desktop Monitors + 21-Day CFR Experimental Graph
December 7, 2020 > 91-DIVOC-01: "An interactive visualization of the exponential spread of COVID-19"
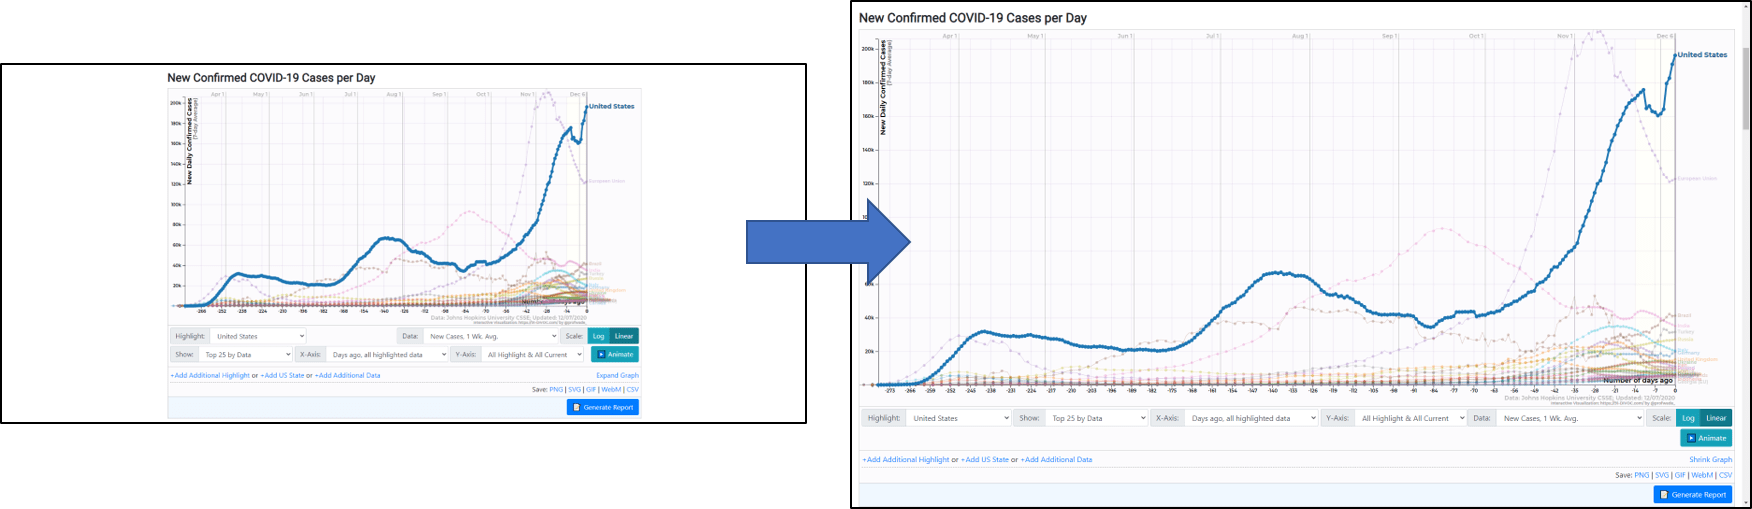
On large/wide monitors, all of the content is centered and there may be a large amount of whitespace on either side of the graphs. Today’s update adds a new option, which you’ll only see on a large monitor, named “Expand Graph”. You’ll find it to the right of “+Add Additional Highlight” on all four of the graphs – click it and see the graph fill up your screen! :)
Additionally, a new experimental graph (21-day lagged CFR) was added at the bottom of the “Data’ selection options.