New Guide and Normalized Graph Improvements
October 18, 2020 > 91-DIVOC-01: "An interactive visualization of the exponential spread of COVID-19"
I’ve added a small guide to the visualization, providing an overview of the key aspects of the visualization including the data sources, regions, normalized data, and more. Additionally:
- Normalized populations are now displayed /100k instead of /1m people in all of the normalized visualizations
- On the normalized visualizations, the default “Show” option is now “Top 25 by Data w/ Pop. >1m”. The previous default, “Top 25 by Data” (without any filters) is still available as a selection. This was done as the default display was dominated by two small countries, The Holy See and Andorra, having 5-10x the normalized cases /day than the rest of the world.
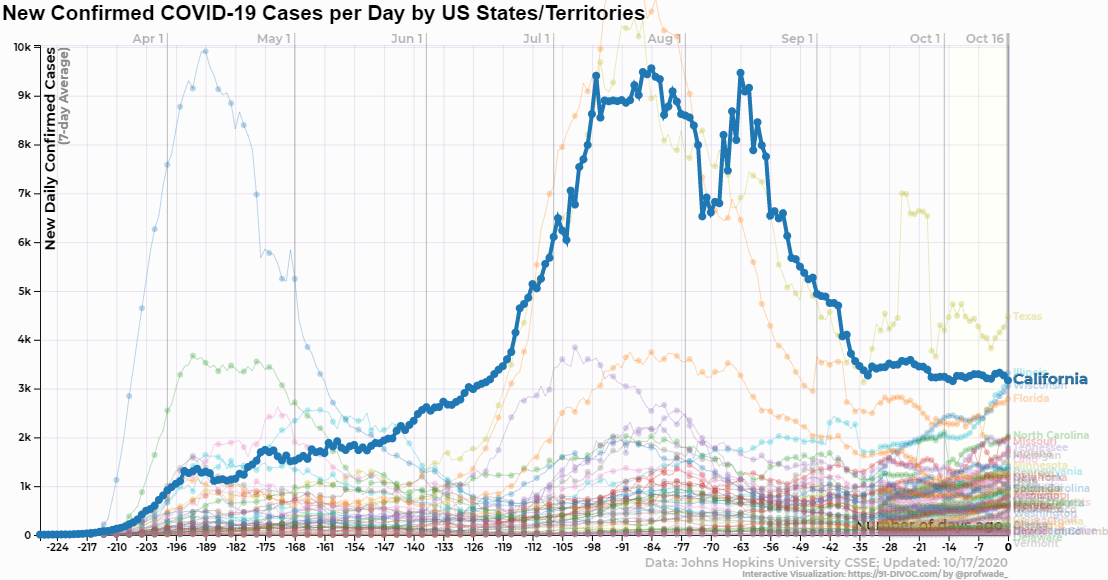
- The default state has been changed from New York to California.