Removed Filter on "Top 10" on Normalized Graphs
September 30, 2020 > 91-DIVOC-01: "An interactive visualization of the exponential spread of COVID-19"
In the early days of the COVID era, The Holy See (Vatican City) confirmed 3 cases on March 24th, 2 more on March 28th, and another 5 cases in April. At that time, the Holy See dominated the normalized cases having an official population of just 799 residents.
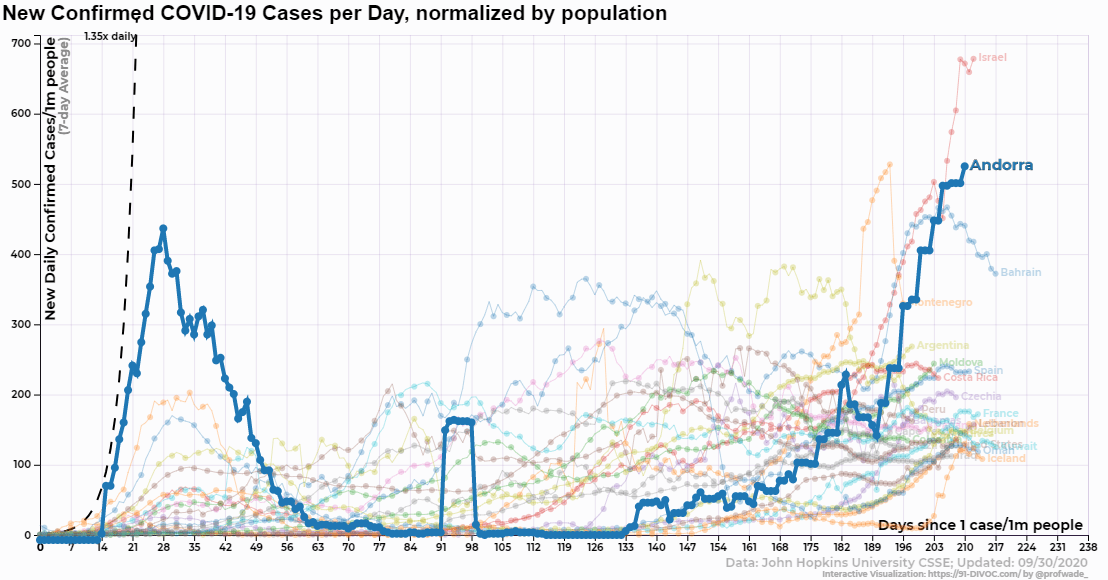
As part of today’s update, I removed this filter completely – the normalized data no longer filters small countries. This is notable as Johns Hopkins University tracks the microstate of Andorra (Wikipedia) – with a ~100 new cases and a population of 77,543, Andorra has been the location of one of fastest spread of COVID-19 on a population-normalized basis (91-DIVOC Graph).
Additionally, a few tooltips were cleaned up. Look for a brand new visualization tomorrow! :)