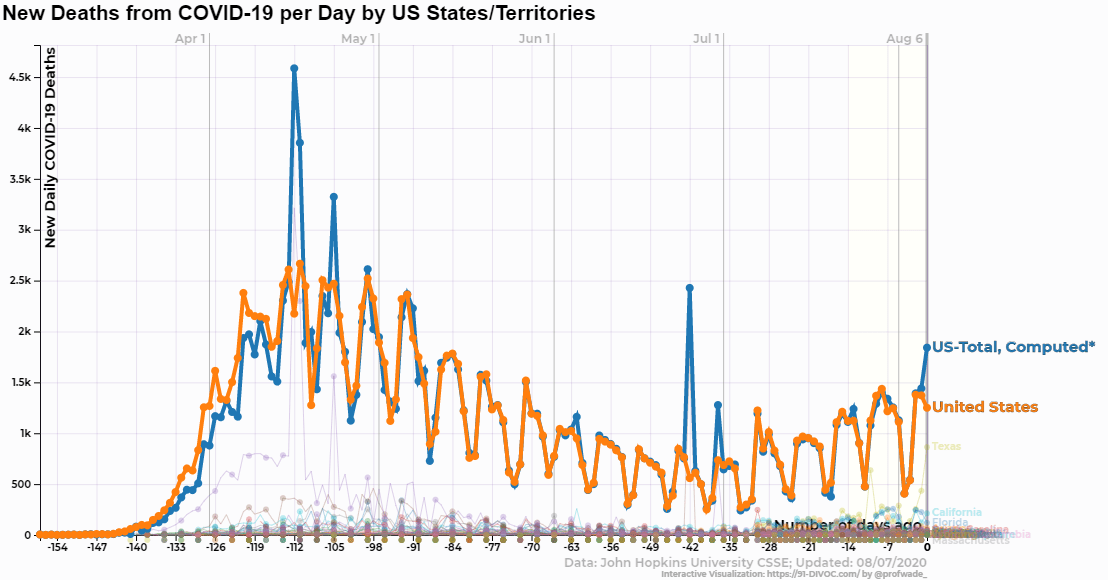
State-computed Values for the United States
August 7, 2020 > 91-DIVOC-01: "An interactive visualization of the exponential spread of COVID-19"

Johns Hopkins University has always reported the “United States” as part of their list of countries and, in a second dataset, reported the 50 states and US territories as individual locations. The number of confirmed cases and deaths between the “United States” total and the sum of the 50 states’ data has always varied slightly, accounting for the cases is the US territories, cruise ships, repatriation flights, and more. Previous cases of large discrepancies between the data have always been paired with a spike in a single state data where a number of previously unreported cases were reported in a single day.
Recently, the difference between the sums (particularly in the number of deaths) has become significant without a known cause. To help dive deep into this difference, I’ve added a new “Data” value in the graphs of the US states:
- Added “Data” value “US-Total, Computed*” to the two graphs of the US states. This data is computed based off the sum of the 50 individual states’ data instead of using the “United States” value.
- You can compare the difference between the two values by choosing one and them using “+Add Additional Data”. You can add this to the “global” graph by choosing “+Add US State” (since the data is computed via the state-level data).