Home
•
Visualizations
91-DIVOC
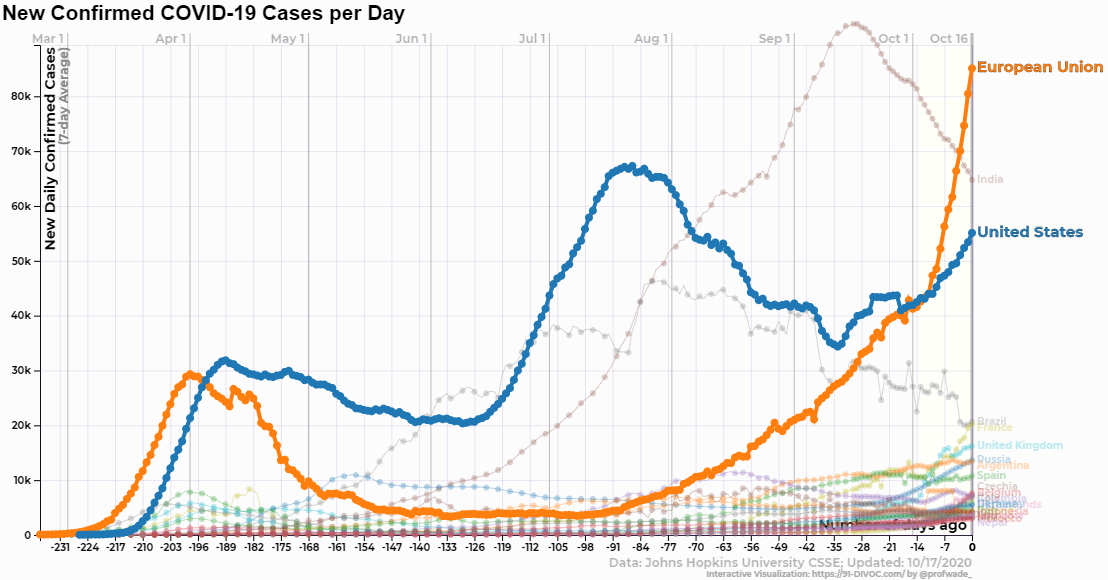
An interactive visualization of the exponential spread of COVID-19
A project to explore the global growth of COVID-19. Updated daily.
Overview and motivations
.
This page is a single-chart subset of the full 91-DIVOC visualization. You can view the other visualizations in the following pages:
Single Page, Main Visualization:
All Four Visualizations
Raw Data:
Countries
,
States/Territories
Population Normalized:
Countries
,
States/Territories
Data Source:
Johns Hopkins & Our World in Data
Johns Hopkins University CSSE
Our World in Data (Oxford, et al)
The COVID Tracking Project (The Atlantic)
New COVID-19 Cases by States/Territories per Day, normalized by population
Loading Data...
Explore More 91-DIVOC
Classic Graphs:
Countries & US States
(#01)
,
Illinois Regions & Countries
(#05)
, and
Big-Ten Schools
(#06)
County-Specific Data:
COVID-19 Data for Locations of People You Love
(#02)
Stacked Contributions Graphs:
States in the US
(#04)
or
Countries in the World
(
NEW
- #07)
Experimental:
1,000-Person Community
(#03)
Join my once monthly updates e-mail:
Join Prof. Wade's e-mail list